The BCG matrix, also known as the Boston growth-share matrix, is a tool to assess a company’s current product portfolio. Based on this assessment, the Boston matrix helps in the long-term strategic planning of the company’s portfolio, as it indicates where to invest, to discontinue, or develop products. As the name suggests, the BCG matrix has been developed by the Boston Consulting Group, and it has become a very popular tool to assess a company’s portfolio and derive strategic investment decisions.
The BCG matrix assesses the company’s product portfolio by placing each product, division, or SBU (strategic business unit) on a 2×2 grid.
The placement of products on the grid is done by investigating two dimensions, which are the axes of the grid: the product life cycle and the experience curve. Since both criteria are rather hard to quantify, proxy values are used to illustrate these two dimensions. The product life cycle is reflected by market growth, and the experience curve is mirrored by the relative market share.
These two values have to be identified for each product/division/SBU to place them on the grid. Based on the position of each product/division/SBU on the BCG matrix, investment or disinvestment decisions can be taken. The graphic below shows the BCG matrix.
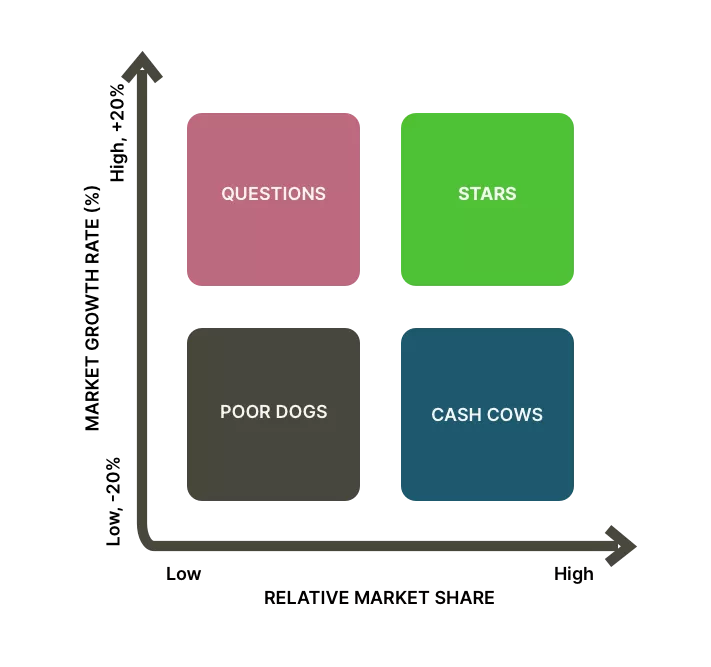
On the vertical axis, the market growth rate provides a measure of the market’s attractiveness. On the horizontal axis, relative market share serves as a measure of the company’s strength in the market. By dividing the BCG matrix into four fields, four types of SBU can be distinguished. These are explained in detail below.
If you want or have to conduct a portfolio analysis using the BCG matrix, you need to know where to get these two numbers for each SBU. The market growth rate can easily be researched: usually, you will find plenty of data for almost every industry and market online. The relative market share is computed by dividing the company’s market share by the market share of the strongest competitor in that market: Relative market share = Company’s market share ÷ largest competitor’s market share.
Now that we have plotted the different products, divisions, or SBUs on the BCG matrix, we need to know what to do next. So how does the BCG matrix help to derive strategic decisions?
To arrive at these decisions, we need to understand the four types of SBU that are distinguished by the Boston growth-share matrix.

Question marks are low-share business units in high-growth markets. They require cash to hold their share, let alone increase it. The company needs to think hard about question marks – which ones should be built into stars, and which ones should be phased out? Question marks have the following characteristics:
Stars are high-growth, high-share businesses or products. They often need heavy investment to finance their rapid growth. Eventually, their growth will slow down, and they will turn into cash cows. Stars have the following characteristics:
Cash cows are low-growth, high-share businesses or products. These established and successful SBUs need less investment to maintain their market share. As a result, they produce cash that the company uses to pay its bills and to support other SBUs that need investment. As we have learned, question marks and stars require heavy investment, which usually comes from profitable cash cows. Cash cows have the following characteristics:
Dogs are low-growth, low-share businesses and products. They may generate enough cash to maintain themselves but do not promise to be large sources of cash flow. Dogs have the following characteristics:
The ideal situation as suggested by the BCG matrix is the following: The company invests in promising Question marks to turn them into Stars. By further investing, Stars are turned into Cash cows. The company harvests all the cash until the Cash cows eventually turn into dogs. At that point, the company divests the product or SBU and focuses on more profitable opportunities.


Email subscription is available ONLY TODAY (oh, okay, and tomorrow).
Surely, we respect your inbox! Unsubscription works every day.

We’d love to tailor your experience — which of these best describes you?

